Frames
Frames turns agent outputs into living, interactive content.
Note: Frames replaces the previous Data Visualization feature with more powerful interactive capabilities.
What's Frames
Instead of static text responses, your agents can create interactive components: reports with live data, dashboards you can explore, calculators, data visualizations, or any interactive element you can describe.
Interactive by design: Your data comes alive. Hover over charts to see details, click legends to filter, use buttons to switch perspectives. Frames transform raw information into something you can touch and explore.
Always evolving: Not happy with the view? Ask your agent to add a regional breakdown, change the time period, or try a different visualization. Your Frame updates instantly while preserving your work.
Built to share: Frames are files you can share via links. Recipients see live data and can interact with the same controls you do. Share internally with your team or externally with clients and partners using secure, token-gated links.
Example Frames
Reports →
Create polished documents with data, charts, and insights. Perfect for client deliverables, executive summaries, or team updates.
Dashboards →
Build interactive views of your data. Team members can filter, explore, and drill down without asking follow-up questions.
How to add Frames to your agent
When creating or editing an agent:
- In the Agent Builder click on Add Capabilities
- Select the Create Frames skill
- Save your agent
That's it. Now ask your agent to create what you need.
Tip: All Frames in a conversation are accessible via the folder icon. You can download them, or share them.
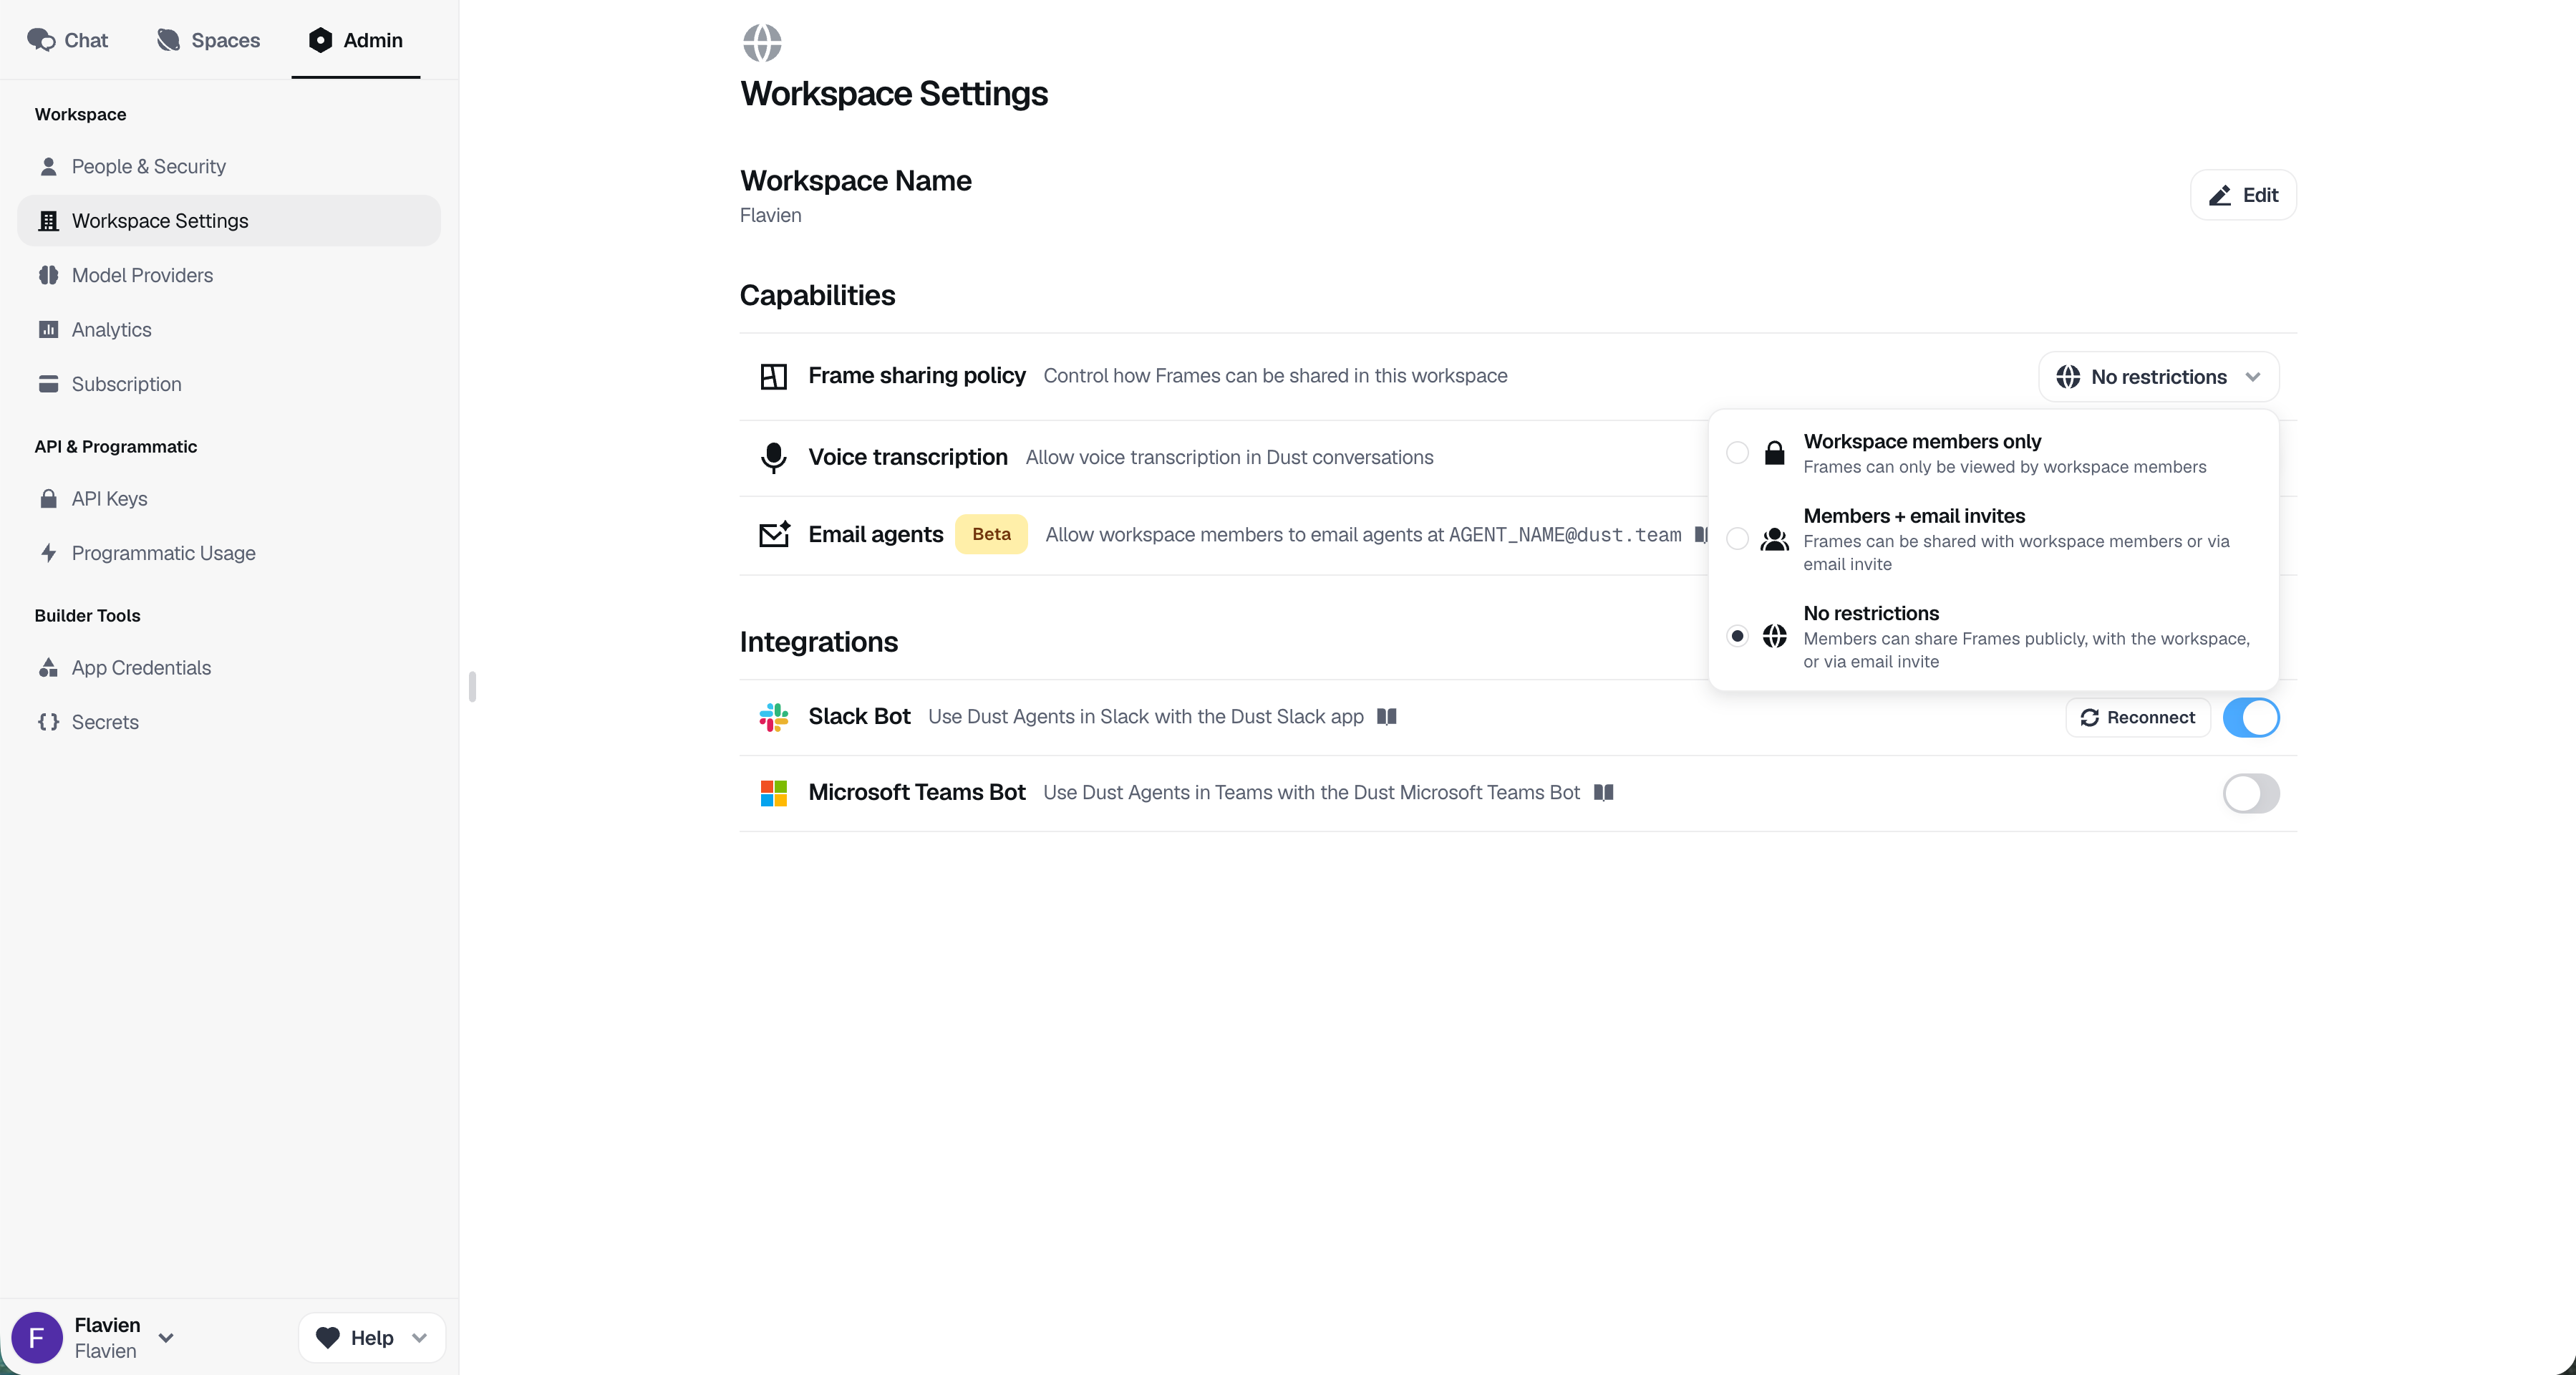
Managing frame sharing
Workspace admins can control how Frames can be shared by members of their workspace. These settings determine the sharing options available when users share Frames.
Public sharing of Frames is enabled by default, allowing you to share Frames externally with clients and partners.
To configure Frame sharing settings::
- Click on the Admin tab
- Go to Workspace Settings
- Select your preferred Frames sharing policy