

Choose a period
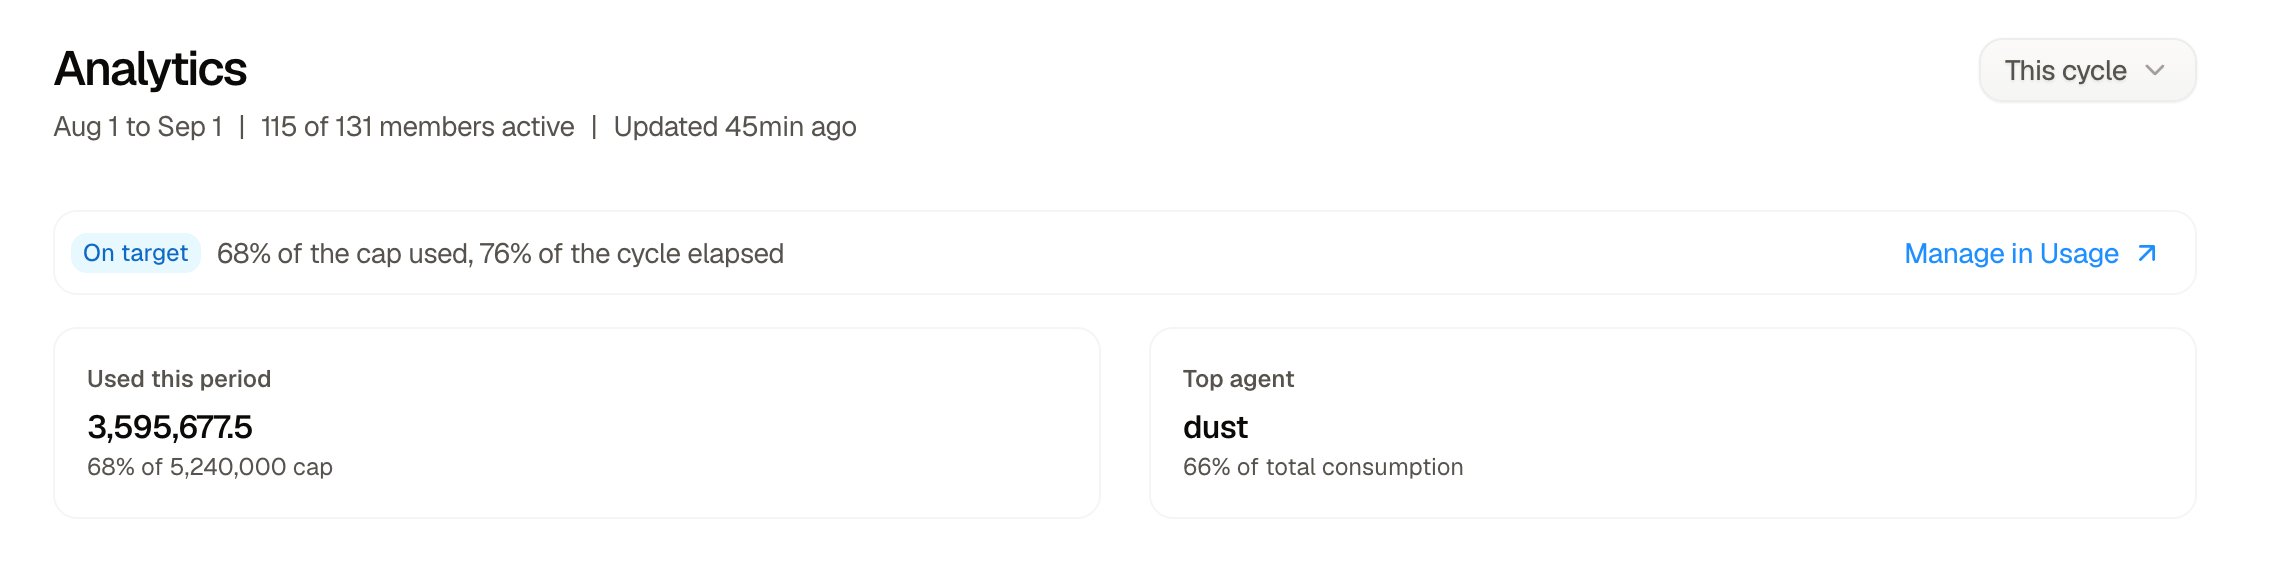
Use the selector at the top right to analyze:- This cycle: the current cycle. This is the default.
- Last 7 days: a rolling seven-day window.
- Last 30 days: a rolling 30-day window.
- Last 90 days: a rolling 90-day window.
- Last 180 days: a rolling 180-day window.
- The start and end dates of the selected period. When This cycle is selected, these are the boundaries of the current credit cycle.
- The number of active members out of all workspace members. Members count as active when they consume credits during the selected period.
- When Analytics data was last updated. For example, Updated 2h ago means the figures were refreshed two hours ago. More recent activity may not appear yet.
Check whether consumption is on track
When This cycle is selected, the status banner compares the percentage of the cap used with the percentage of the cycle elapsed.- On target means the remaining credits are likely to cover the rest of the cycle at the current pace.
- Off target means consumption is ahead of pace and deserves attention.
- Critical means the remaining credits are unlikely to cover the rest of the cycle.
- Used this period: total credits consumed during the selected period. For This cycle, the card also shows the percentage and total value of the cap.
- Top agent: the agent with the highest credit consumption, together with its share of all consumption during the period.
Filters in the Explore section do not change the status banner or summary cards. They apply to the consumption chart, Attribution, and raw-data export.
Investigate consumption over time
The Consumption chart provides two views of the selected period.Find spikes with the per-period view
Per period displays credits consumed in the selected granularity as stacked bars. With Daily, Weekly, or Monthly granularity, each bar represents the corresponding day, week, or month. The bars are broken down using the dimension selected in Attribution. For example, selecting Models in Attribution changes the chart from an agent breakdown to a model breakdown. The chart displays the five highest-consuming contributors individually. Others combines the remaining contributors. Hover over a bar to see the credits attributed to each contributor and the total for that period. When Daily granularity is selected, the Today (partial) marker identifies the current, incomplete day. Its bar is faded because today’s usage is still being added, so the total may increase. Avoid comparing it directly with completed days.Follow the trajectory with the Cumulative view
Cumulative shows how actual consumption builds over the period. For an unfiltered This cycle view, the chart also shows a target line that spreads the cap evenly across the cycle. Hover over the chart to compare actual and target consumption and see how far consumption is ahead of or behind the target. The target line is not displayed for rolling periods or while an Explore filter is active.Filter the analysis
Select Filters in the Explore section to narrow the chart, Attribution, and raw-data export by:- Agents
- Members
- Groups
- Models
- Tools
- Skills
- Sources
- Triggers
- API keys
Each value in a filter category is checked for activity given the selected period and the values already applied to the other categories. A value with no matching activity in that context is marked No activity. It stays visible so you can see what exists in the workspace, but you cannot select it until another filter change makes it available again. If a value you already selected later shows No activity because of a change elsewhere, it remains selected and you can still remove it.
Find what drives consumption
Attribution ranks contributors for the selected period and filters. Choose the dimension that answers your question:
Triggers attributes consumption to the specific trigger, such as a schedule or webhook. This differs from the triggered source, which only indicates that the request originated from automation.
Member consumption is attributed to the member who triggered it. Group consumption is attributed to every group that member belongs to, so the same consumption can appear under more than one group.
The selected Attribution tab also controls the breakdown used by the per-period chart.
Analytics includes consumption from agents marked Not published, including agents you do not have access to as an editor. This gives admins and managers a complete view of workspace consumption without exposing the agent’s description. For an inaccessible not-published agent, Analytics shows the creator’s email address in place of the description.
Read the attribution table
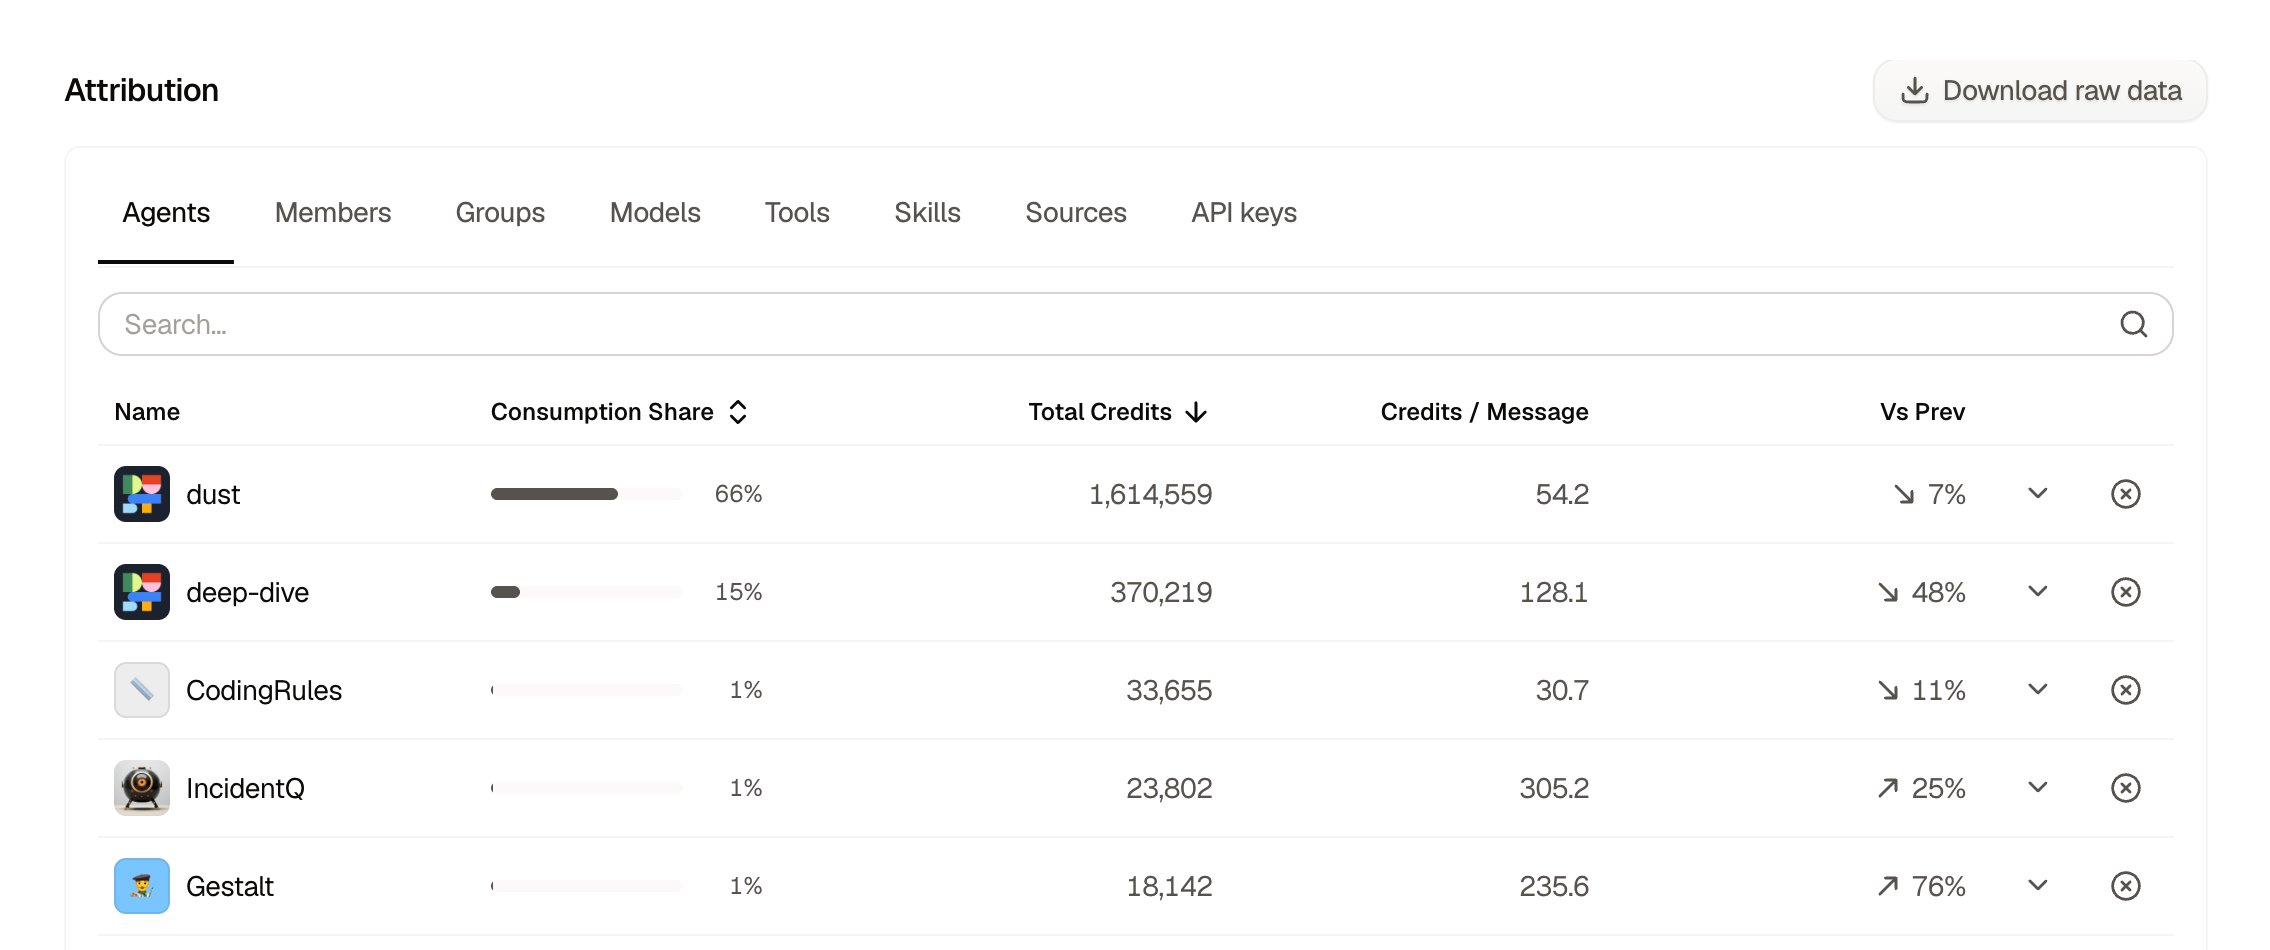
Use the search field to find a value in the active tab. Results are initially ranked by Total credits, from highest to lowest, and are paginated when necessary. The table includes:- Consumption share: the contributor’s percentage of all credits in the selected scope, not only the credits represented by the visible rows.
- Total credits: credits attributed to the contributor.
- Credits / message: average credits generated by each originating user message, including all model and tool work that message triggers. This metric is shown for agents, members, groups, models, sources, and API keys.
- Credits / invocation: average credits per invocation for tools and skills.
- Vs Prev: the change from the previous period. This cycle compares the current cycle with the previous cycle. Rolling periods compare with the immediately preceding window of the same length.
--appears when there is not enough previous data to calculate a percentage.
Drill into a contributor
Select a row or its chevron to expand it. The breakdown shows up to three leading models, tools, and members where they provide an additional perspective. Select View all in an expanded breakdown to apply the original row as a filter and open the corresponding Attribution tab. For example, from an agent row, select View all under models to see every model used by that agent. Use the funnel icon at the end of a row to add that contributor directly to the Explore filters. Select it again to remove the filter.Download raw data
Select Download raw data above Attribution to generate a CSV for the selected period and Explore filters. If no matching export is ready, opening the panel starts one automatically. You can also select New export to generate a fresh file. The export contains consumption records with metadata such as timestamps, conversation and message identifiers, agents, members, groups, models, sources, API keys, tools, skills, credit components, status, and execution time. The active Attribution tab, table search, and table sort order do not restrict the export. Generated exports are kept for a maximum of 15 days.Analytics and raw-data exports do not include message content.
Metric definitions
Export analytics through the API
For programmatic reporting, useGET /api/v1/w/{wId}/analytics/export with a workspace admin API key. This API export is separate from the raw-data export generated in the Analytics page. See the Dust API documentation for authentication and endpoint details.